
 A Oneindia Venture


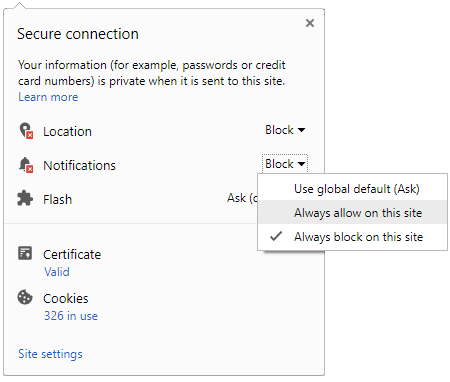
 Click it and Unblock the Notifications
SBI Contra Fund
3 Year Absolute Returns
28.82% ↑
NAV (₹) on 16 Oct 2026
62.93
1 Day NAV Change
0.26%
Risk Level
Very High Risk
Rating
-
SBI Contra Fund is a Equity mutual fund categorized under Diversified, offered by SBI Funds Management Ltd.. Launched on 14 Jul 1999, investors can start with a minimum SIP of ₹100 or a lumpsum ... Read more
NAV History
Fund Details
Returns Calculator
Asset Allocation
AUM
₹ 45,067.51 Cr
Sector Holdings
| Sectors | Weightage |
|---|---|
| Finance - Banks - Private Sector | 15.60% |
| Pharmaceuticals | 6.93% |
| Treps/Reverse Repo | 6.40% |
| Refineries | 5.75% |
| Power - Generation/Distribution | 5.04% |
| IT Consulting & Software | 4.88% |
| Finance - Banks - Public Sector | 4.60% |
| Iron & Steel | 2.96% |
| Cement | 2.86% |
| Telecom Equipment | 2.66% |
| E-Commerce/E-Retail | 2.58% |
| Gas Transmission/Marketing | 2.33% |
| Auto - LCVs/HCVs | 2.19% |
| Non-Banking Financial Company (NBFC) | 1.95% |
| Auto - 2 & 3 Wheelers | 1.87% |
| Cigarettes & Tobacco Products | 1.81% |
| Finance - Life Insurance | 1.62% |
| Personal Care | 1.59% |
| Port & Port Services | 1.58% |
| Abrasives And Grinding Wheels | 1.47% |
| Agro Chemicals/Pesticides | 1.46% |
| Hospitals & Medical Services | 1.42% |
| Logistics - Warehousing/Supply Chain/Others | 1.37% |
| Chemicals - Speciality | 1.33% |
| Treasury Bill | 1.30% |
| Telecom Services | 1.23% |
| Auto Ancl - Electrical | 1.21% |
| Oil Drilling And Exploration | 1.20% |
| Aluminium | 1.18% |
| Foreign Securities | 1.05% |
| Auto - Cars & Jeeps | 1.04% |
| Financial Technologies (Fintech) | 1.02% |
| Real Estate Investment Trusts (REIT) | 1.01% |
| Others - Not Mentioned | 0.94% |
| Beverages & Distilleries | 0.94% |
| Construction, Contracting & Engineering | 0.84% |
| Consumer Electronics | 0.80% |
| Realty | 0.62% |
| LPG/CNG/PNG/LNG Bottling/Distribution | 0.60% |
| Mining/Minerals | 0.48% |
| Textiles - Spinning - Cotton Blended | 0.46% |
| Finance - Mutual Funds | 0.33% |
| Infrastructure - General | 0.32% |
| Diversified | 0.31% |
| Engineering - Heavy | 0.30% |
| Exchange Platform | 0.27% |
| Bearings | 0.25% |
| Compressors | 0.21% |
| Domestic Appliances | 0.18% |
| Plywood/Laminates | 0.09% |
| Cables - Power/Others | 0.08% |
| Auto Ancl - Dr. Trans & Steer - Others | 0.08% |
| Derivatives | 0.04% |
Stock Holdings
| Name | Weightage | Value (in Cr.) | Sector |
|---|---|---|---|
| TREPS | 6.40% | ₹ 2,882.86 | Others |
| HDFC Bank Ltd. | 4.79% | ₹ 2,157.94 | Finance - Banks - Private Sector |
| Reliance Industries Ltd. | 4.67% | ₹ 2,103.08 | Refineries |
| ICICI Bank Ltd. | 4.36% | ₹ 1,966.89 | Finance - Banks - Private Sector |
| Biocon Ltd. | 3.29% | ₹ 1,483.94 | Pharmaceuticals |
| Kotak Mahindra Bank Ltd. | 3.15% | ₹ 1,419 | Finance - Banks - Private Sector |
| Punjab National Bank | 2.91% | ₹ 1,309.76 | Finance - Banks - Public Sector |
| Indus Towers Ltd. | 2.66% | ₹ 1,198.97 | Telecom Equipment |
| Torrent Power Ltd. | 2.48% | ₹ 1,119.12 | Power - Generation/Distribution |
| GAIL (India) Ltd. | 2.33% | ₹ 1,049.12 | Gas Transmission/Marketing |
| Tata Steel Ltd. | 2.13% | ₹ 959.60 | Iron & Steel |
| Mahindra & Mahindra Financial Services Ltd. | 1.95% | ₹ 877.33 | Non-Banking Financial Company (NBFC) |
| ITC Ltd. | 1.81% | ₹ 814.91 | Cigarettes & Tobacco Products |
| Tech Mahindra Ltd. | 1.79% | ₹ 807.06 | IT Consulting & Software |
| State Bank of India | 1.60% | ₹ 719.67 | Finance - Banks - Public Sector |
| Dabur India Ltd. | 1.59% | ₹ 716.36 | Personal Care |
| JSW Infrastructure Ltd. | 1.58% | ₹ 713.20 | Port & Port Services |
| FSN E-Commerce Ventures Ltd. | 1.58% | ₹ 710.05 | E-Commerce/E-Retail |
| Bandhan Bank Ltd. | 1.46% | ₹ 656.65 | Finance - Banks - Private Sector |
| Aster DM Quality Care Ltd. | 1.42% | ₹ 641.35 | Hospitals & Medical Services |
| Bajaj Auto Ltd. | 1.35% | ₹ 606.32 | Auto - 2 & 3 Wheelers |
| Axis Bank Ltd. | 1.33% | ₹ 601.26 | Finance - Banks - Private Sector |
| Cognizant Technology Solutions Corporation | 1.32% | ₹ 595.12 | IT Consulting & Software |
| Delhivery Ltd. | 1.26% | ₹ 568.85 | Logistics - Warehousing/Supply Chain/Others |
| Bharti Airtel Ltd. | 1.23% | ₹ 553.82 | Telecom Services |
| Samvardhana Motherson International Ltd. | 1.21% | ₹ 543.18 | Auto Ancl - Electrical |
| Oil & Natural Gas Corporation Ltd. | 1.20% | ₹ 539.59 | Oil Drilling And Exploration |
| Hindalco Industries Ltd. | 1.18% | ₹ 531.18 | Aluminium |
| Tata Motors Ltd. | 1.16% | ₹ 522.61 | Auto - LCVs/HCVs |
| Cipla Ltd. | 1.15% | ₹ 516.46 | Pharmaceuticals |
| Indian Oil Corporation Ltd. | 1.08% | ₹ 486.42 | Refineries |
| ICICI Prudential Life Insurance Company Ltd. | 1.08% | ₹ 485.34 | Finance - Life Insurance |
| NHPC Ltd. | 1.08% | ₹ 487.83 | Power - Generation/Distribution |
| Epam Systems Inc | 1.05% | ₹ 472.88 | Others |
| UPL Ltd. | 1.05% | ₹ 472.55 | Agro Chemicals/Pesticides |
| Maruti Suzuki India Ltd. | 1.04% | ₹ 470.86 | Auto - Cars & Jeeps |
| Tata Motors Passenger Vehicles Ltd. | 1.03% | ₹ 464.78 | Auto - LCVs/HCVs |
| One 97 Communications Ltd. | 1.02% | ₹ 461.38 | Financial Technologies (Fintech) |
| Embassy Office Parks Reit | 1.01% | ₹ 456.88 | Real Estate Investment Trusts (REIT) |
| Swiggy Ltd. | 1.00% | ₹ 449.88 | E-Commerce/E-Retail |
| 364 DAY T-BILL 06.11.26 | 0.94% | ₹ 422.80 | Others - Not Mentioned |
| United Spirits Ltd. | 0.88% | ₹ 397.68 | Beverages & Distilleries |
| Larsen & Toubro Ltd. | 0.84% | ₹ 377.88 | Construction, Contracting & Engineering |
| JSW Energy Ltd. | 0.83% | ₹ 372.20 | Power - Generation/Distribution |
| JSW Steel Ltd. | 0.81% | ₹ 363.49 | Iron & Steel |
| Whirlpool of India Ltd. | 0.80% | ₹ 359.66 | Consumer Electronics |
| Grasim Industries Ltd. | 0.76% | ₹ 341.58 | Cement |
| Mankind Pharma Ltd. | 0.74% | ₹ 332.51 | Pharmaceuticals |
| Gland Pharma Ltd. | 0.72% | ₹ 322.71 | Pharmaceuticals |
| Prism Johnson Ltd. | 0.68% | ₹ 305.68 | Cement |
| Neogen Chemicals Ltd. | 0.68% | ₹ 306.03 | Chemicals - Speciality |
| 91 DAY T-BILL 19.11.26 | 0.66% | ₹ 297.86 | Others |
| Grindwell Norton Ltd. | 0.66% | ₹ 298.45 | Abrasives And Grinding Wheels |
| Apar Industries Ltd. | 0.65% | ₹ 293.55 | Chemicals - Speciality |
| CESC Ltd. | 0.65% | ₹ 292.51 | Power - Generation/Distribution |
| Nuvoco Vistas Corporation Ltd. | 0.63% | ₹ 282.75 | Cement |
| Ashiana Housing Ltd. | 0.62% | ₹ 277.50 | Realty |
| Infosys Ltd. | 0.61% | ₹ 275.10 | IT Consulting & Software |
| Petronet LNG Ltd. | 0.60% | ₹ 269.83 | LPG/CNG/PNG/LNG Bottling/Distribution |
| Life Insurance Corporation of India | 0.54% | ₹ 245.12 | Finance - Life Insurance |
| Wipro Ltd. | 0.53% | ₹ 237.75 | IT Consulting & Software |
| Hero MotoCorp Ltd. | 0.52% | ₹ 235.20 | Auto - 2 & 3 Wheelers |
| Equitas Small Finance Bank Ltd. | 0.51% | ₹ 228.17 | Finance - Banks - Private Sector |
| Carborundum Universal Ltd. | 0.50% | ₹ 227.17 | Abrasives And Grinding Wheels |
| NMDC Ltd. | 0.48% | ₹ 218.44 | Mining/Minerals |
| K.P.R. Mill Ltd. | 0.46% | ₹ 208.10 | Textiles - Spinning - Cotton Blended |
| Lupin Ltd. | 0.45% | ₹ 202 | Pharmaceuticals |
| 91 DAY T-BILL 31.12.26 | 0.44% | ₹ 197.29 | Others |
| Tata Consultancy Services Ltd. | 0.42% | ₹ 191.20 | IT Consulting & Software |
| Rallis India Ltd. | 0.41% | ₹ 183.34 | Agro Chemicals/Pesticides |
| The Ramco Cements Ltd. | 0.40% | ₹ 178.15 | Cement |
| ACC Ltd. | 0.39% | ₹ 173.77 | Cement |
| HDFC Asset Management Co. Ltd. | 0.33% | ₹ 147.91 | Finance - Mutual Funds |
| G R Infra projects Ltd. | 0.32% | ₹ 144.57 | Infrastructure - General |
| WENDT (India) Ltd. | 0.31% | ₹ 138.94 | Abrasives And Grinding Wheels |
| E.I.D-Parry (India) Ltd. | 0.31% | ₹ 138.44 | Diversified |
| Disa India Ltd. | 0.30% | ₹ 135.31 | Engineering - Heavy |
| Indian Energy Exchange Ltd. | 0.27% | ₹ 119.55 | Exchange Platform |
| Timken India Ltd. | 0.25% | ₹ 113.63 | Bearings |
| Syngene International Ltd. | 0.23% | ₹ 104.19 | Pharmaceuticals |
| Ingersoll Rand (India) Ltd. | 0.21% | ₹ 95.13 | Compressors |
| HCL Technologies Ltd. | 0.21% | ₹ 94.23 | IT Consulting & Software |
| Aurobindo Pharma Ltd. | 0.18% | ₹ 83.32 | Pharmaceuticals |
| V-Guard Industries Ltd. | 0.18% | ₹ 80.23 | Domestic Appliances |
| 182 DAY T-BILL 05.11.26 | 0.17% | ₹ 74.62 | Others |
| Sanofi India Ltd. | 0.17% | ₹ 76.91 | Pharmaceuticals |
| Gateway Distriparks Ltd. | 0.11% | ₹ 51.70 | Logistics - Warehousing/Supply Chain/Others |
| Bank of India | 0.09% | ₹ 42.80 | Finance - Banks - Public Sector |
| Greenply Industries Ltd. | 0.09% | ₹ 40.50 | Plywood/Laminates |
| Motherson Sumi Wiring India Ltd. | 0.08% | ₹ 36.07 | Cables - Power/Others |
| Automotive Axles Ltd. | 0.08% | ₹ 34.13 | Auto Ancl - Dr. Trans & Steer - Others |
| Sula Vineyards Ltd. | 0.06% | ₹ 27.15 | Beverages & Distilleries |
| Margin amount for Derivative positions | 0.04% | ₹ 20.14 | Others |
| 364 DAY T-BILL 19.11.26 | 0.03% | ₹ 14.89 | Others |
| NMDC Steel Ltd. | 0.02% | ₹ 10.77 | Iron & Steel |
Returns
| Annualised returns | ||||
|---|---|---|---|---|
| 9M | 1Y | 2Y | 3Y | |
| Fund returns | -7.58% | -5.91% | -4.24% | 8.81% |
| Category returns | 0.91% | -0.23% | -1.06% | 33.01% |
Fund Objective
To provide the investors maximum growth opportunity through equity investments in stocks of growth oriented sectors of the economy. There are five sub-funds dedicated to specific investment themes ... Read more
AMC Details
Top Funds from Equity - Contra
|
Scheme Name
|
NAV
|
Returns
1Y
3Y
5Y
|
AUM (Cr)
|
Expense Ratio
|
Risk Meter
|
||
|---|---|---|---|---|---|---|---|
|
Kotak Contra Fund - Direct Plan
Diversified
Direct
|
₹174.96 | -4.34% | 46.65% | 79.59% | ₹5,196 | 0.80% |
Very High
|
|
Kotak Contra Fund - Direct Plan
Diversified
Direct
|
₹62.26 | -4.34% | 46.64% | 79.59% | ₹5,196 | 0.80% |
Very High
|
|
Kotak Contra Fund - Direct Plan
Diversified
Direct
|
₹62.26 | -4.34% | 46.64% | 79.59% | ₹5,196 | 0.80% |
Very High
|
|
Invesco India Contra Fund - Direct Plan
Diversified
Direct
|
₹154.30 | -4.89% | 45.68% | 71.31% | ₹19,248 | 0.78% |
Very High
|
|
Kotak Contra Fund - Regular Plan
Diversified
Regular
|
₹146.05 | -5.53% | 41.07% | 68.06% | ₹5,196 | 2.03% |
Very High
|
|
Kotak Contra Fund - Regular Plan
Diversified
Regular
|
₹50.34 | -5.52% | 41.07% | 68.06% | ₹5,196 | 2.03% |
Very High
|
|
Kotak Contra Fund - Regular Plan
Diversified
Regular
|
₹50.34 | -5.52% | 41.07% | 68.06% | ₹5,196 | 2.03% |
Very High
|
|
Invesco India Contra Fund
Diversified
Regular
|
₹129.86 | -5.93% | 40.88% | 61.72% | ₹19,248 | 1.87% |
Very High
|
|
SBI Contra Fund - Direct Plan
Diversified
Direct
|
₹400.15 | -5.19% | 32.19% | 85.73% | ₹45,068 | 0.88% |
Very High
|
|
SBI Contra Fund - Direct Plan
Diversified
Direct
|
₹84.45 | -5.19% | 32.19% | 85.72% | ₹45,068 | 0.88% |
Very High
|
Top Funds from SBI Funds Management Ltd.
|
Scheme Name
|
NAV
|
Returns
1Y
3Y
5Y
|
AUM (Cr)
|
Expense Ratio
|
Risk Meter
|
||
|---|---|---|---|---|---|---|---|
|
SBI Gold ETF
ETF
Regular
|
₹123.75 | 14.05% | 140.09% | 189.12% | ₹26,466 | 0.65% |
High
|
|
SBI Gold Fund - Direct Plan
Fund of Funds
Direct
|
₹44.30 | 14.04% | 139.89% | 191.21% | ₹17,423 | 0.25% |
Very High
|
|
SBI Gold Fund - Direct Plan
Fund of Funds
Direct
|
₹44.30 | 14.04% | 139.89% | 191.21% | ₹17,423 | 0.25% |
Very High
|
|
SBI Gold Fund - Direct Plan
Fund of Funds
Direct
|
₹44.37 | 14.04% | 139.89% | 191.22% | ₹17,423 | 0.25% |
Very High
|
|
SBI Gold Fund
Fund of Funds
Regular
|
₹42.30 | 13.85% | 138.54% | 187.77% | ₹17,423 | 0.42% |
Very High
|
|
SBI Gold Fund
Fund of Funds
Regular
|
₹42.31 | 13.84% | 138.51% | 187.74% | ₹17,423 | 0.42% |
Very High
|
|
SBI Gold Fund
Fund of Funds
Regular
|
₹42.31 | 13.84% | 138.51% | 187.74% | ₹17,423 | 0.42% |
Very High
|
|
SBI US Specific Equity Active FoF - Direct Plan
Fund of Funds
Direct
|
₹24.66 | 20.26% | 98.01% | 112.43% | ₹1,168 | 1.03% |
Very High
|
|
SBI US Specific Equity Active FoF - Direct Plan
Fund of Funds
Direct
|
₹24.66 | 20.26% | 98.00% | 112.43% | ₹1,168 | 1.03% |
Very High
|
|
SBI US Specific Equity Active FoF - Direct Plan
Fund of Funds
Direct
|
₹24.66 | 20.26% | 98.00% | 112.43% | ₹1,168 | 1.03% |
Very High
|
FAQs
What is the current NAV of SBI Contra Fund Regular IDCW?
What is the fund size (AUM) of SBI Contra Fund Regular IDCW?
What are the historical returns of SBI Contra Fund Regular IDCW?
What is the risk level of SBI Contra Fund Regular IDCW?
What is the minimum investment amount for SBI Contra Fund Regular IDCW?
Disclaimer: This is 3rd Party content/feed, viewers are requested to use their discretion and conduct proper diligence before investing, GoodReturns does not take any liability on the genuineness and correctness of the information in this article
-
Block for 8 hours
-
Block for 12 hours
-
Block for 24 hours
-
Don't block

 Sign in with Google
- Male
- Female
- Others
- Under 18
- 18 to 25
- 26 to 35
- 36 to 45
- 45 to 55
- 55+